What’s New With These Indices?
These indices are the first to combine information from multiple data sources on COVID-19 policies and restrictions. We expect these aggregate results to be less sensitive to data coding errors and other measurement issues that arise whenever we try to accurately describe government policies. These are also continuous measures with a minimum of value of 0 and a maximum value of 100, which may permit more fine-grained distinctions between countries.
Second, and we think quite importantly, these indices have measures of uncertainty. In other words, we are not just releasing an index value for each country and each day but also a range of plausible index values for each country and each day. By doing so we are sharing not just what we think the best answer is, but also how uncertain we are about other plausible answers. This information can help you figure out whether possible measurement and data coding errors could impact your analyses.
The new indices are designed to solve a specific problem: we have a lot of data across multiple datasets but sometimes we really just want an aggregate, summary measure. At present, the only other aggregate measure for COVID-19 policies is the Stringency Index, which gives a single value for each country. By contrast, these indices are at a lower level of aggregation, assigning a value for specific policy domains. So in principle, these indices are best used when you want a measure of a certain policy domain like school restrictions or masking, but you also don’t want to get too lost in the underlying policy details.
For that reason, it is important to know the differences between the CoronaNet and OxCGRT datasets. The underlying data from CoronaNet, as we mentioned, contains 154 different indicators which are specific details of different policies, such as whether countries provide tests to all of the population or implement restrictions for specific business industries. You can read about all the indicators we have released so far in this codebook. Note that these 154 indicators are different than the CoronaNet raw data, which contain even more policy information but have not yet been released in this easier to use format.
The OxCGRT indicators, by contrast, are all coded on a qualitative scale and tend to have a lot more information in each indicator. For example, while CoronaNet has separate indicators for primary, secondary and elementary school closure, the OxCGRT data has this information contained within a single variable. You can learn more about the OxCGRT data in their working paper.
Practically speaking, it makes a difference when you are trying to interpret the results of a model or analysis. If you use an index for masks, for example, and find an association with COVID-19 cases, you can interpret that association as applying to a fairly broad array of mask-related restrictions and policies in a country. By contrast, if you use the OxCGRT mask indicator or one of several CoronaNet mask indicators, you can explain an association in terms of very specific mask-related policies and a COVID-19 outcome.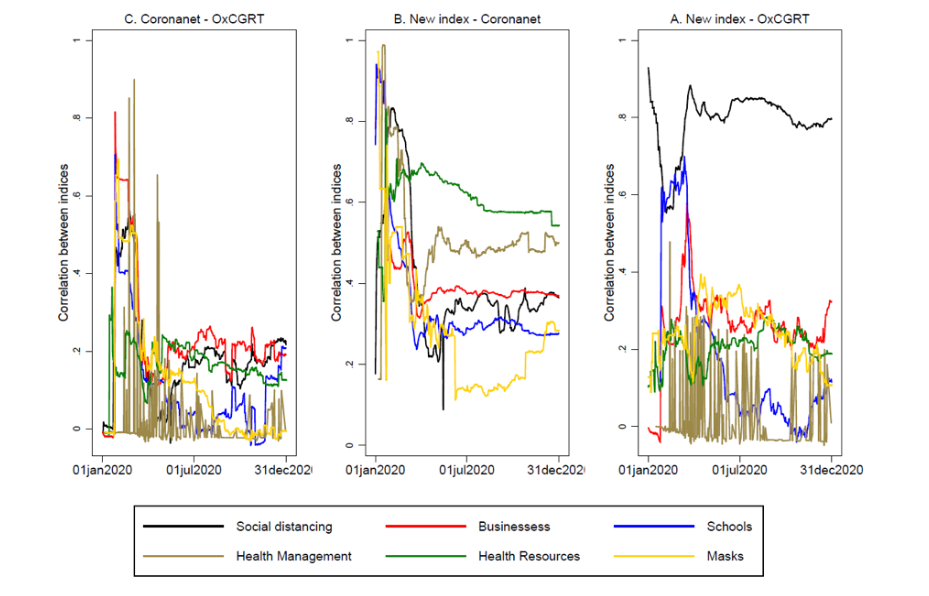
Figure: Daily Cross-sectional Correlations between the Aggregated Raw Data and Estimated Indices
It is better to use the indices mainly in the following situations:
You are concerned about data coding errors affecting your analysis. In that case, you can use our measures of uncertainty to see if different plausible values for policy activity affect your results. We wrote a blog post about how to do this with the R statistical software package.
You are trying to measure the simultaneous effect of multiple policies on an outcome. It may not be a good idea to include lots of policy indicators in the same analysis/model because these different policies may interact with each other, rendering interpretation difficult. By using the indices, you can avoid this problem and still obtain clear results because the indices are all independent of each other and combine information from lower-level indicators.
It is better to use the raw data in the following situations:
Your research question is on a specific attribute or dimension of policy, such as antigen tests as opposed to all possible COVID-19 tests. There are more specific indicators on those types of policies.
You are not concerned about measurement error, such as when you are quite familiar with the data and data coding errors are unlikely to affect your analyses.